 |
Icetips Xplore Documentation
11/2/2015 Output Menu |
|
Previous Top Next |
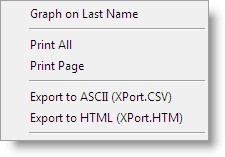
The Output menu gives the end user an option to take the content of the browse and print it, create a graph on it or export it.

Current options are to create a graph which has an "Output" button which creates the graph as a bitmap image on the clipboard so it can be pasted into documents.
The data can also be sent to a report that is constructed on the fly to try to accommodate the data in the browse using the same formatting information as the browse uses. It can be either "All" or "Page" All will print all the data available in the dataset, i.e. everything that can be browsed with the filters being applied. Page will only print the records visible in the listbox.