 |
Icetips Xplore Documentation
9/11/2011 Column Field Assignments |
|
Previous Top Next |
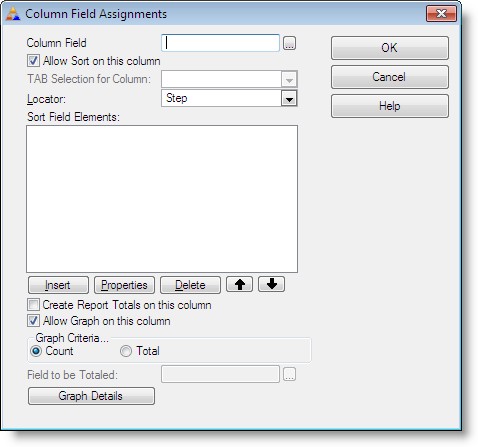
You only need to use the Column Field Assignment if you have local variable in your listbox. This allows you to specify exactly how that column should behave when the user clicks on the header, what fields to use to sort it and how to interpret this column for reports and graphs.

| Column field | Select the field to display in the listbox. Note that this must be a local variable and cannot be a field in the View. |
| Allow Sort on this column | Indicates if the header sort is allowed for this column or not. If this is unchecked, the end user cannot re-order the browse based on this column. Defaults to checked. |
| TAB Selection for Column | This drop down will only be active if you have specified "Seperate TABs for each Column(Wizard Sheet)" on the General tab. This allows the developer to select a different TAB for this particular column. |
| Locator | Locator type to use for this column. The available options are "None", "Step", "Entry", "Incremental" and "Filtered". Default locator type is "Step" Filtered is a nice option for string fields. |
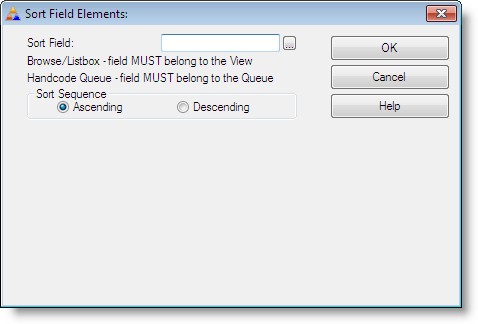
| Sort Field Elements | Here you can specify the order to use for the column. You can use one field or multiple fields and determine which direction, ascending or descending, each of them uses, just like when you build a key in the dictionary. This allows you to build more complex sort orders for a column than the data in that column indicates. You can insert, change and delete elements from the order and also move them up and down in the list to suit your needs. Note that if you enable sorting on this column then the fields added to the "Sort Field Elements" must be in the view as either fields in the browse or hotfields. |
| Create Report Totals... | Gives you the option of creating totals on this column at the end of the built-in view report. Usually this should only be specified on columns showing numeric data. |
| Allow Graph on this column | Specifies whether the end-user can create a bar graph of the column data. e.g. if the column is displaying 'Country', then it might be useful to create a bar graph of which countries the current filtered view has selected. It would not be logical to create a graph of a field such as an 'Address' column. Default is off. |
| Graph Criteria... | Indicates if the graph should show the "Count" of each occurrence of data in the column or a "Total". Default is "Count" |
| Field to be Totaled: | Enabled if "Total" is selected in the "Graph Criteria..." above. Select the data field to be totalled. |
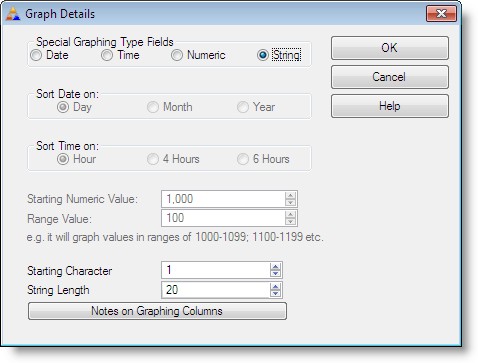
| Graph Details | Opens a window with information on how to interpret the data for the graph. Icetips Xplore can handle Date, Time and Sub(String,n,m) If you need anything more complex, just enter your own code into the embed "Xplore: Modify Column String for Graph" "Date" columns can graph on Day of the Week; Month of the Year; or by Year. "Time" columns can graph by Hour; 4 Hour segments or 6 Hour segments. "Numeric" columns allow specification of a range along with a starting value. "String" columns will graph on any simple string slice.  |